As I’ve started to use my bike more and more for short commutes and errands, I’ve been noticing the absurdity of how deeply engrained car ownership has become. Cars are silly expensive and, oftentimes, cars are slow.
Cars are Expensive
Here in Denver, and for the hobbies I pursue, car ownership seems like a necessary evil. It’s the only viable way to get deep into the mountains, especially in the winter, or to the further reaches of the city and suburbs given the rampant urban sprawl. As someone who works from home and loves riding my bike, I should be the perfect candidate for ditching my car. And yet, when it came down to it, I still found it far more “logical” to spend $1,000 on a set of winter tires for my car for the ski season than spending a couple hundred to refurbish my commuter bike that’s served me tirelessly for years and years with zero recurring costs. That skewed sense of logic is car brain talking, so let’s put some actual numbers to it.
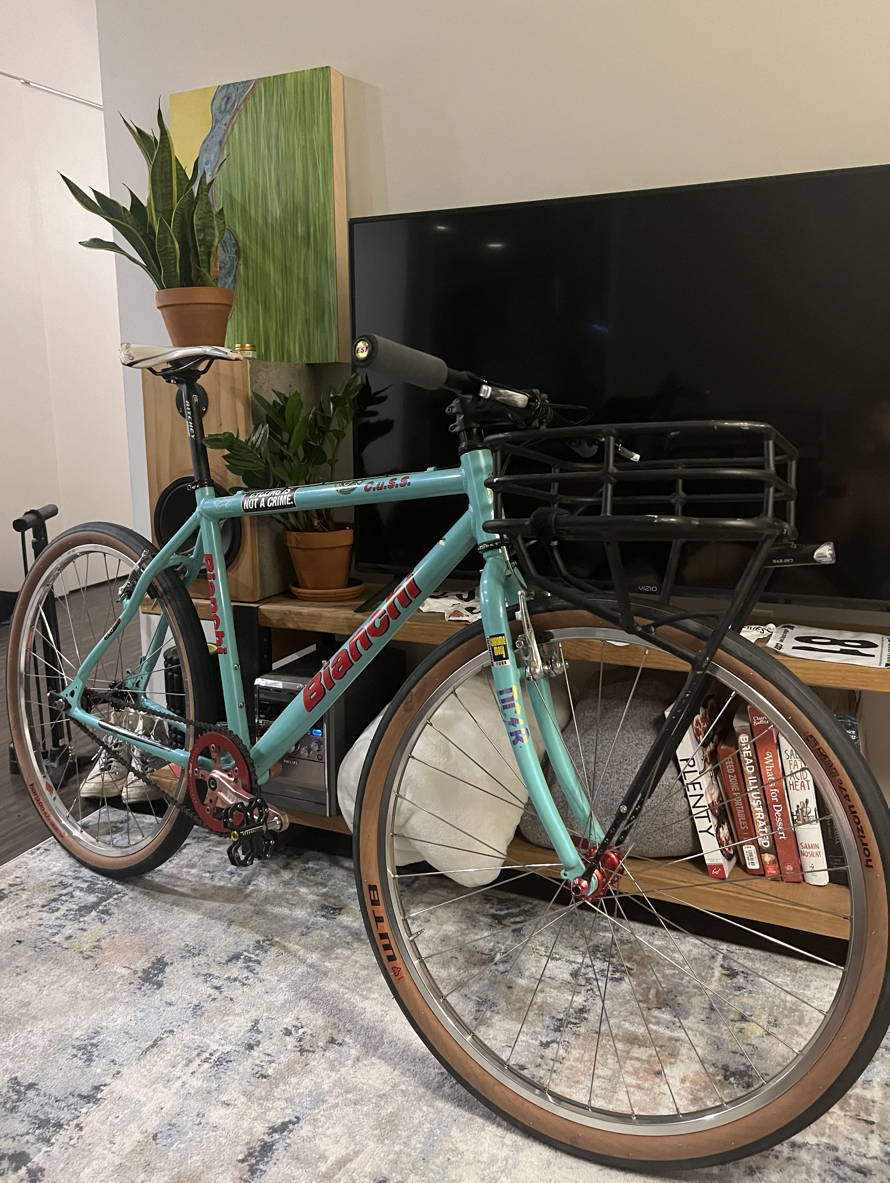
Update: I pulled the trigger on refreshing the bike. Look at it - it’s beatiful.
My main car usage comes from driving to and from ski trips and bike races - roughly 50 trips per year, at roughly 120 miles per round trip. Add in another 1,000 miles as a buffer for other miscellaneous trips and we’re at 7,000 miles per year - definitely on the low end for US drivers.
If I didn’t own my own car, I could use Zipcar or another car sharing service. It would cost roughly $110/day for a full day rental of a 4WD car (a legal requirement for driving to ski areas in the winter in the absence of winter tires). This is all-inclusive of gas and insurance, but slightly less convenient to need to walk to a pickup location (roughly half a mile).
Gaming this all out over a 10 year span:
| Personal Car | Zipcar | |
|---|---|---|
| Purchase Price | $18,000 | $0 |
| Forgone Investment Earnings | $11,320 (10 yrs @ 5%) | $0 |
| Insurance | $8,400 ($70/month) | $0 |
| Registration + Emissions | $2,000 (~$200/yr) | $0 |
| Gas | $8,000 (7k miles @ 35 mpg, $4/gal) | $0 |
| Repairs | $9,000 ($900/yr) | $0 |
| Parking | $10,800 ($90/month) | $0 |
| Membership Fee | $0 | $900 ($90/yr) |
| Hourly Rental Costs | $0 | $3000 (20hr/yr) |
| Rental Costs | $ 0 | $55,000 |
| Total | $67,520 | $58,900 |
At 50 trips per year, I’m paying over $8k over 10 years for the priviledge of parking closer to home and independence from the pricing whims of Zipcar, but also the priviledge of dealing with the DMV, insurance companies, mechanics, etc. The huge fixed costs of personal car ownership become apparent when we plot this out over a range of trip frequencies:
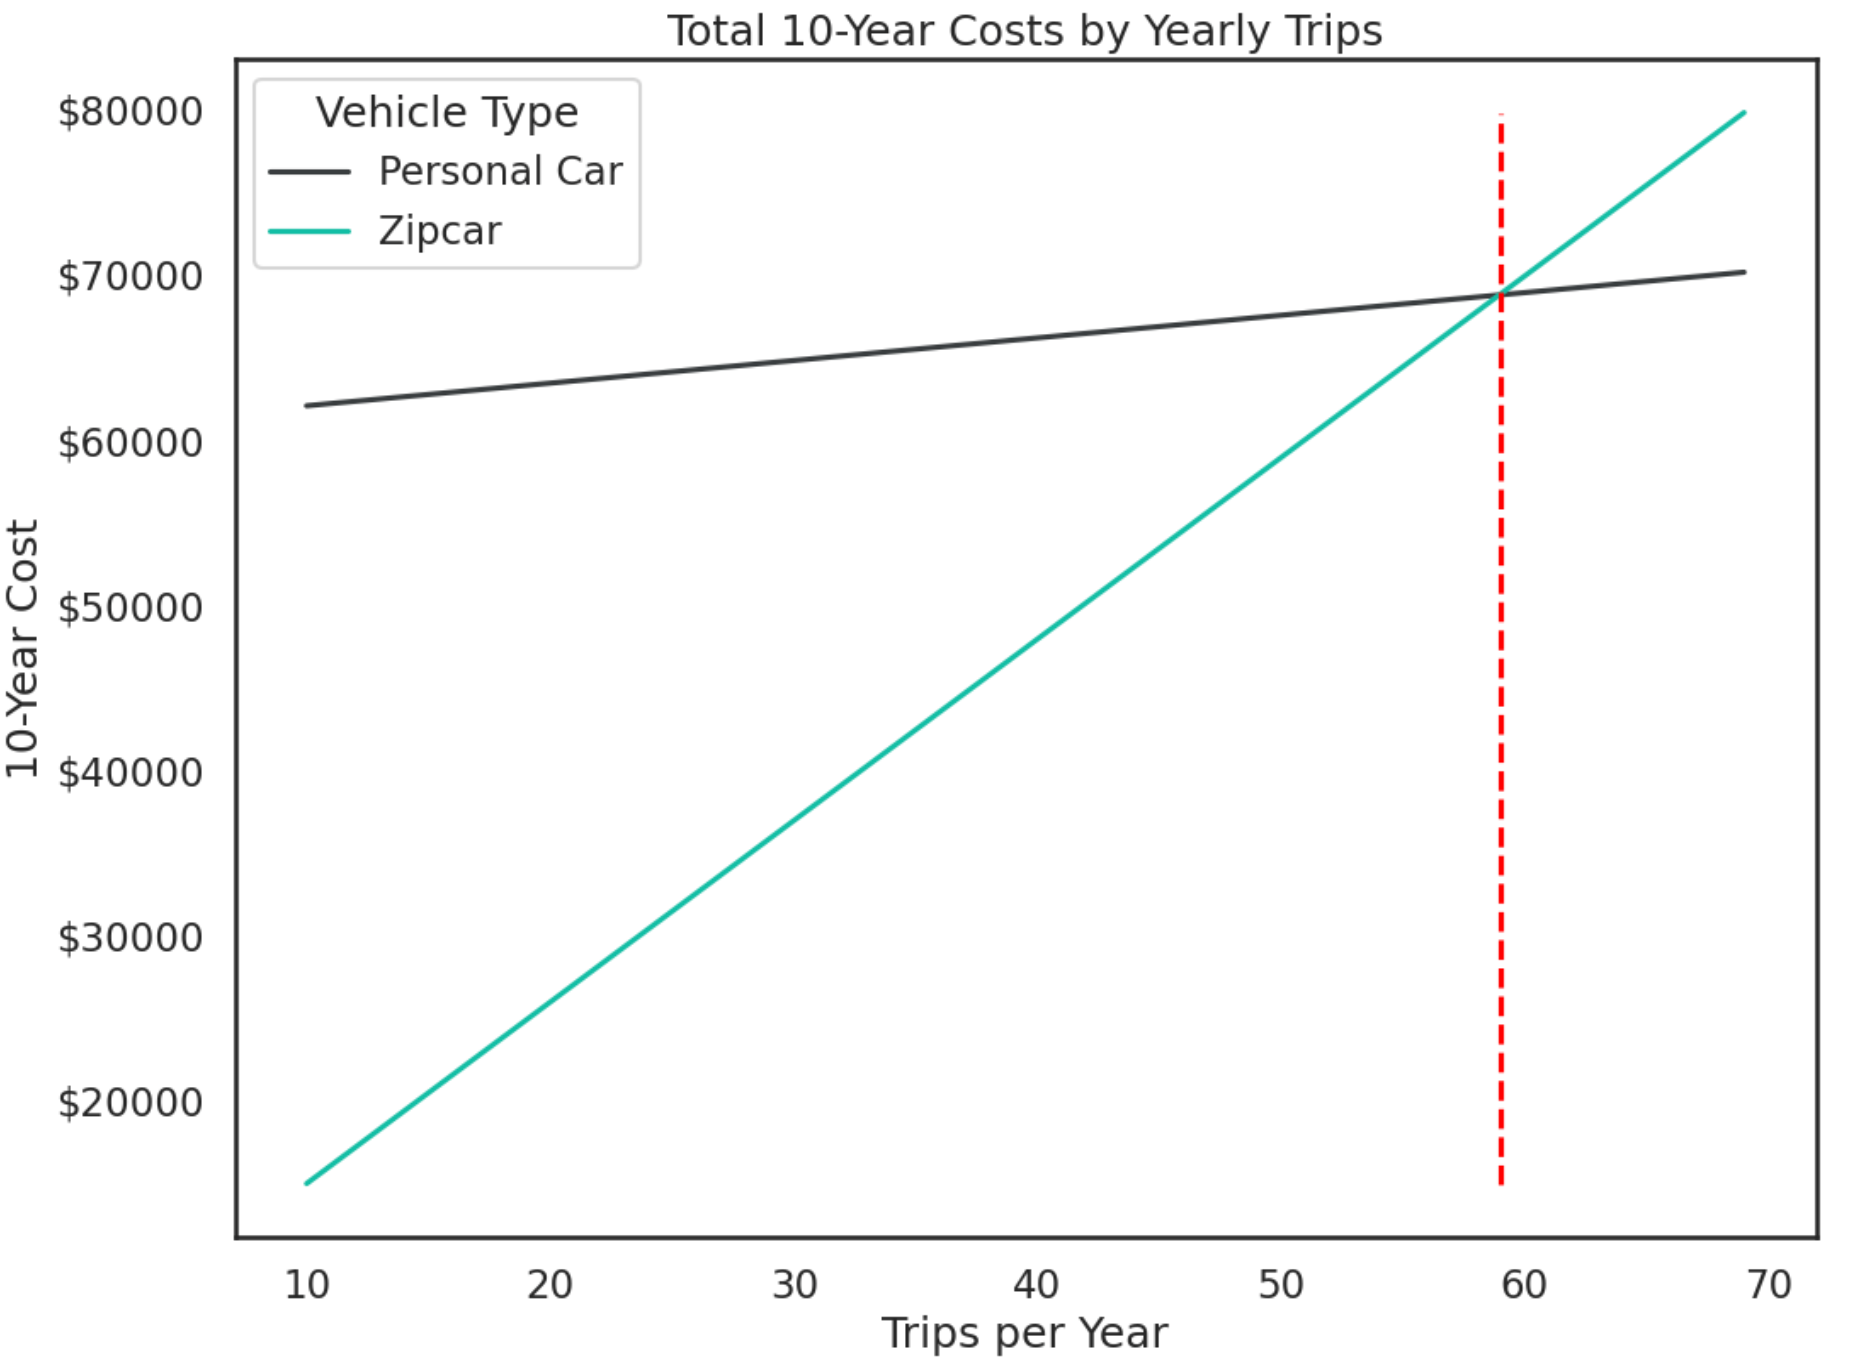
If I didn’t want to travel for skiing and biking and landed closer to ~20 full-day car trips per year, there would be absolutely no case to be made for personal vehicle ownership.
Cars are Slow
Outside of longer trips, most of my around-town trips are in the 2-4 mile round-trip range, which I’ve usually considered to be a toss-up between biking and driving. If the weather looks nice, I’ll usually take my bike, and if I’m just not feeling it I’ll usually take my car. After a few trips to the grocery store on the same route via both car and bike, I found myself much more annoyed with the car trips. To see if I could find a clear reason why, I conducted a (very un-scientific) experiment by recording a trip via GPS both in the car and on my bike. All small-sample-size caveats aside, each trip felt representative of a typical trip, and the findings definitely resonate with how each mode makes me feel.
Experiment Setting
- Trips conducted on exactly the same route through downtown Denver.
- GPS tracking was conducted via Strava with all auto-pause features turned off.
- Tracking began as soon as I left my front door, and ended when I entered the front door of the grovery store.
- Bike trip utilized the Colorado Safety Stop, a new law as of April 2022 allowing cyclists to effectively treat stop signs as yields and red lights as stop signs.
Plotting the average as-the-crow-flies distance to the destination over time, we see a few clear findings
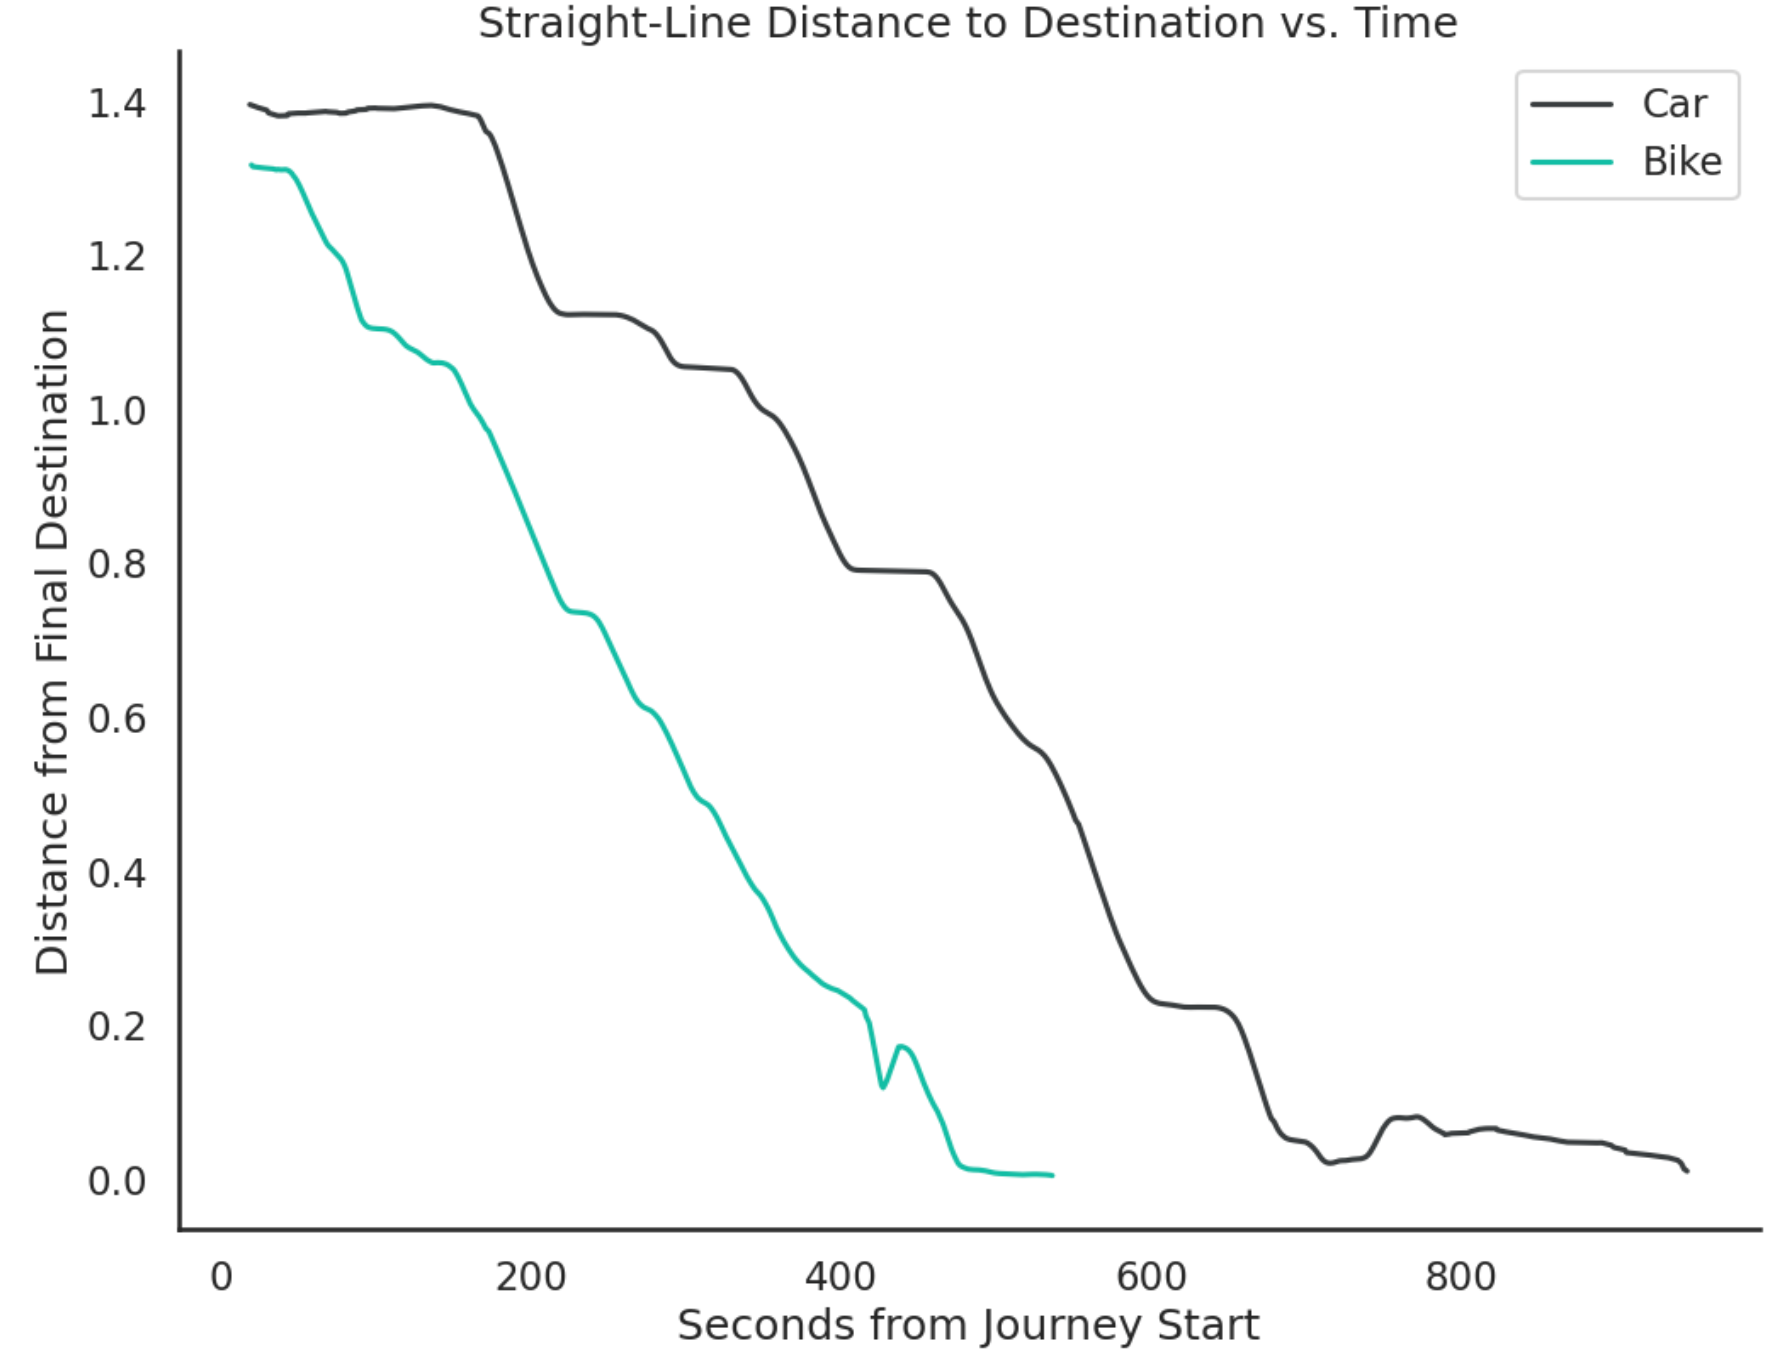
- Surprisingly, the bike trip was faster overall, taking less than 10 minutes vs. more than 15 in the car.
- Both trips have a similar characteristic shape, but the horizontal portions (indicating time spent stopped or otherwise not progressing towards the destination) are much more significant on the plot for the car trip:
- The roughly flat portions at the beginning and end of the trip represent time walking to my car, getting out of my apartment parking garage, parking in the grocery store garage, and taking the elevator to the store level. The much shorter bike equivalent was a trip down the elevator and a walk out of my apartment building lobby, then locking my bike by the front door and walking into the store.
- Similar horizontal portions in the middle of the ride represent stop lights and stop signs. While much of the time in the car trip was spent waiting for a green light despite a lack of cross traffic, the bike trip plot shows I was able to move past those same locations relatively quickly after stopping.
Looking at some overall stats for the trips, we can see the car trip reached a higher top speed, but the longer sustained periods spent stopped or navigating slow parking garages meant the overall trip time was much longer.
| Car | Bike | |
|---|---|---|
| Total Time (mm:ss) | 15:49 | 9:00 |
| Total Stopped Time (mm:ss) | 3:51 | 0:22 |
| % of Trip Stopped | 24.3% | 4.1% |
| Top Speed (mph) | 26.6 | 20.5 |
| Avg. Speed (mph) | 9.7 | 13.3 |
| Avg. Moving Speed (mph) | 13.6 | 12.4 |
The portion of the trip spent stopped is perhaps the single most damning finding here - I absolutely abhor unnecessary waiting. The slower average moving speed on the bike is entirely worth to me it for the greater fraction of time spent making progress, and I imagine that takeaway would hold up even if the total trip times were the same (or even slightly favored the car)
Bike Glamor Shot